Onderstaande printversie van het indicatorenboek werd door uw browser gegenereerd, en zal niet steeds optimaal ogen. Via de ingebouwde printfunctie op de website van het Indicatorenboek (ronde knop rechts bovenaan) kan u een printvriendelijke PDF genereren met mooi ogende lay-out.
7.3.2Refinements
As a first step, a number of refinements of the current key indicator were considered, namely a breakdown by type of organization, by technology domains and also a breakdown between SME’s and large companies. VARIO came to the following findings:
1. The evolution of EPO patent applications and awarded USPTO patents from companies and non-companies (higher education institutions, government institutions and public knowledge institutions, hospitals) between 2001-2017 (see Figure 3) shows that the absolute numbers are increasing for both categories. Among companies, there is an increase of about 40%, mostly realized in the first five years. Among non-companies, the numbers increase fairly consistently (tripling, or an average of 6-7% growth per year). As a result, their share is now about 20% of the Flemish patent applications. This is exceptionally high in an international context.
Figure 3: Number of Flemish EPO patent applications and USPTO patent awards (years) applied for by ’companies’ and ‘non-companies’ between 2001-2017
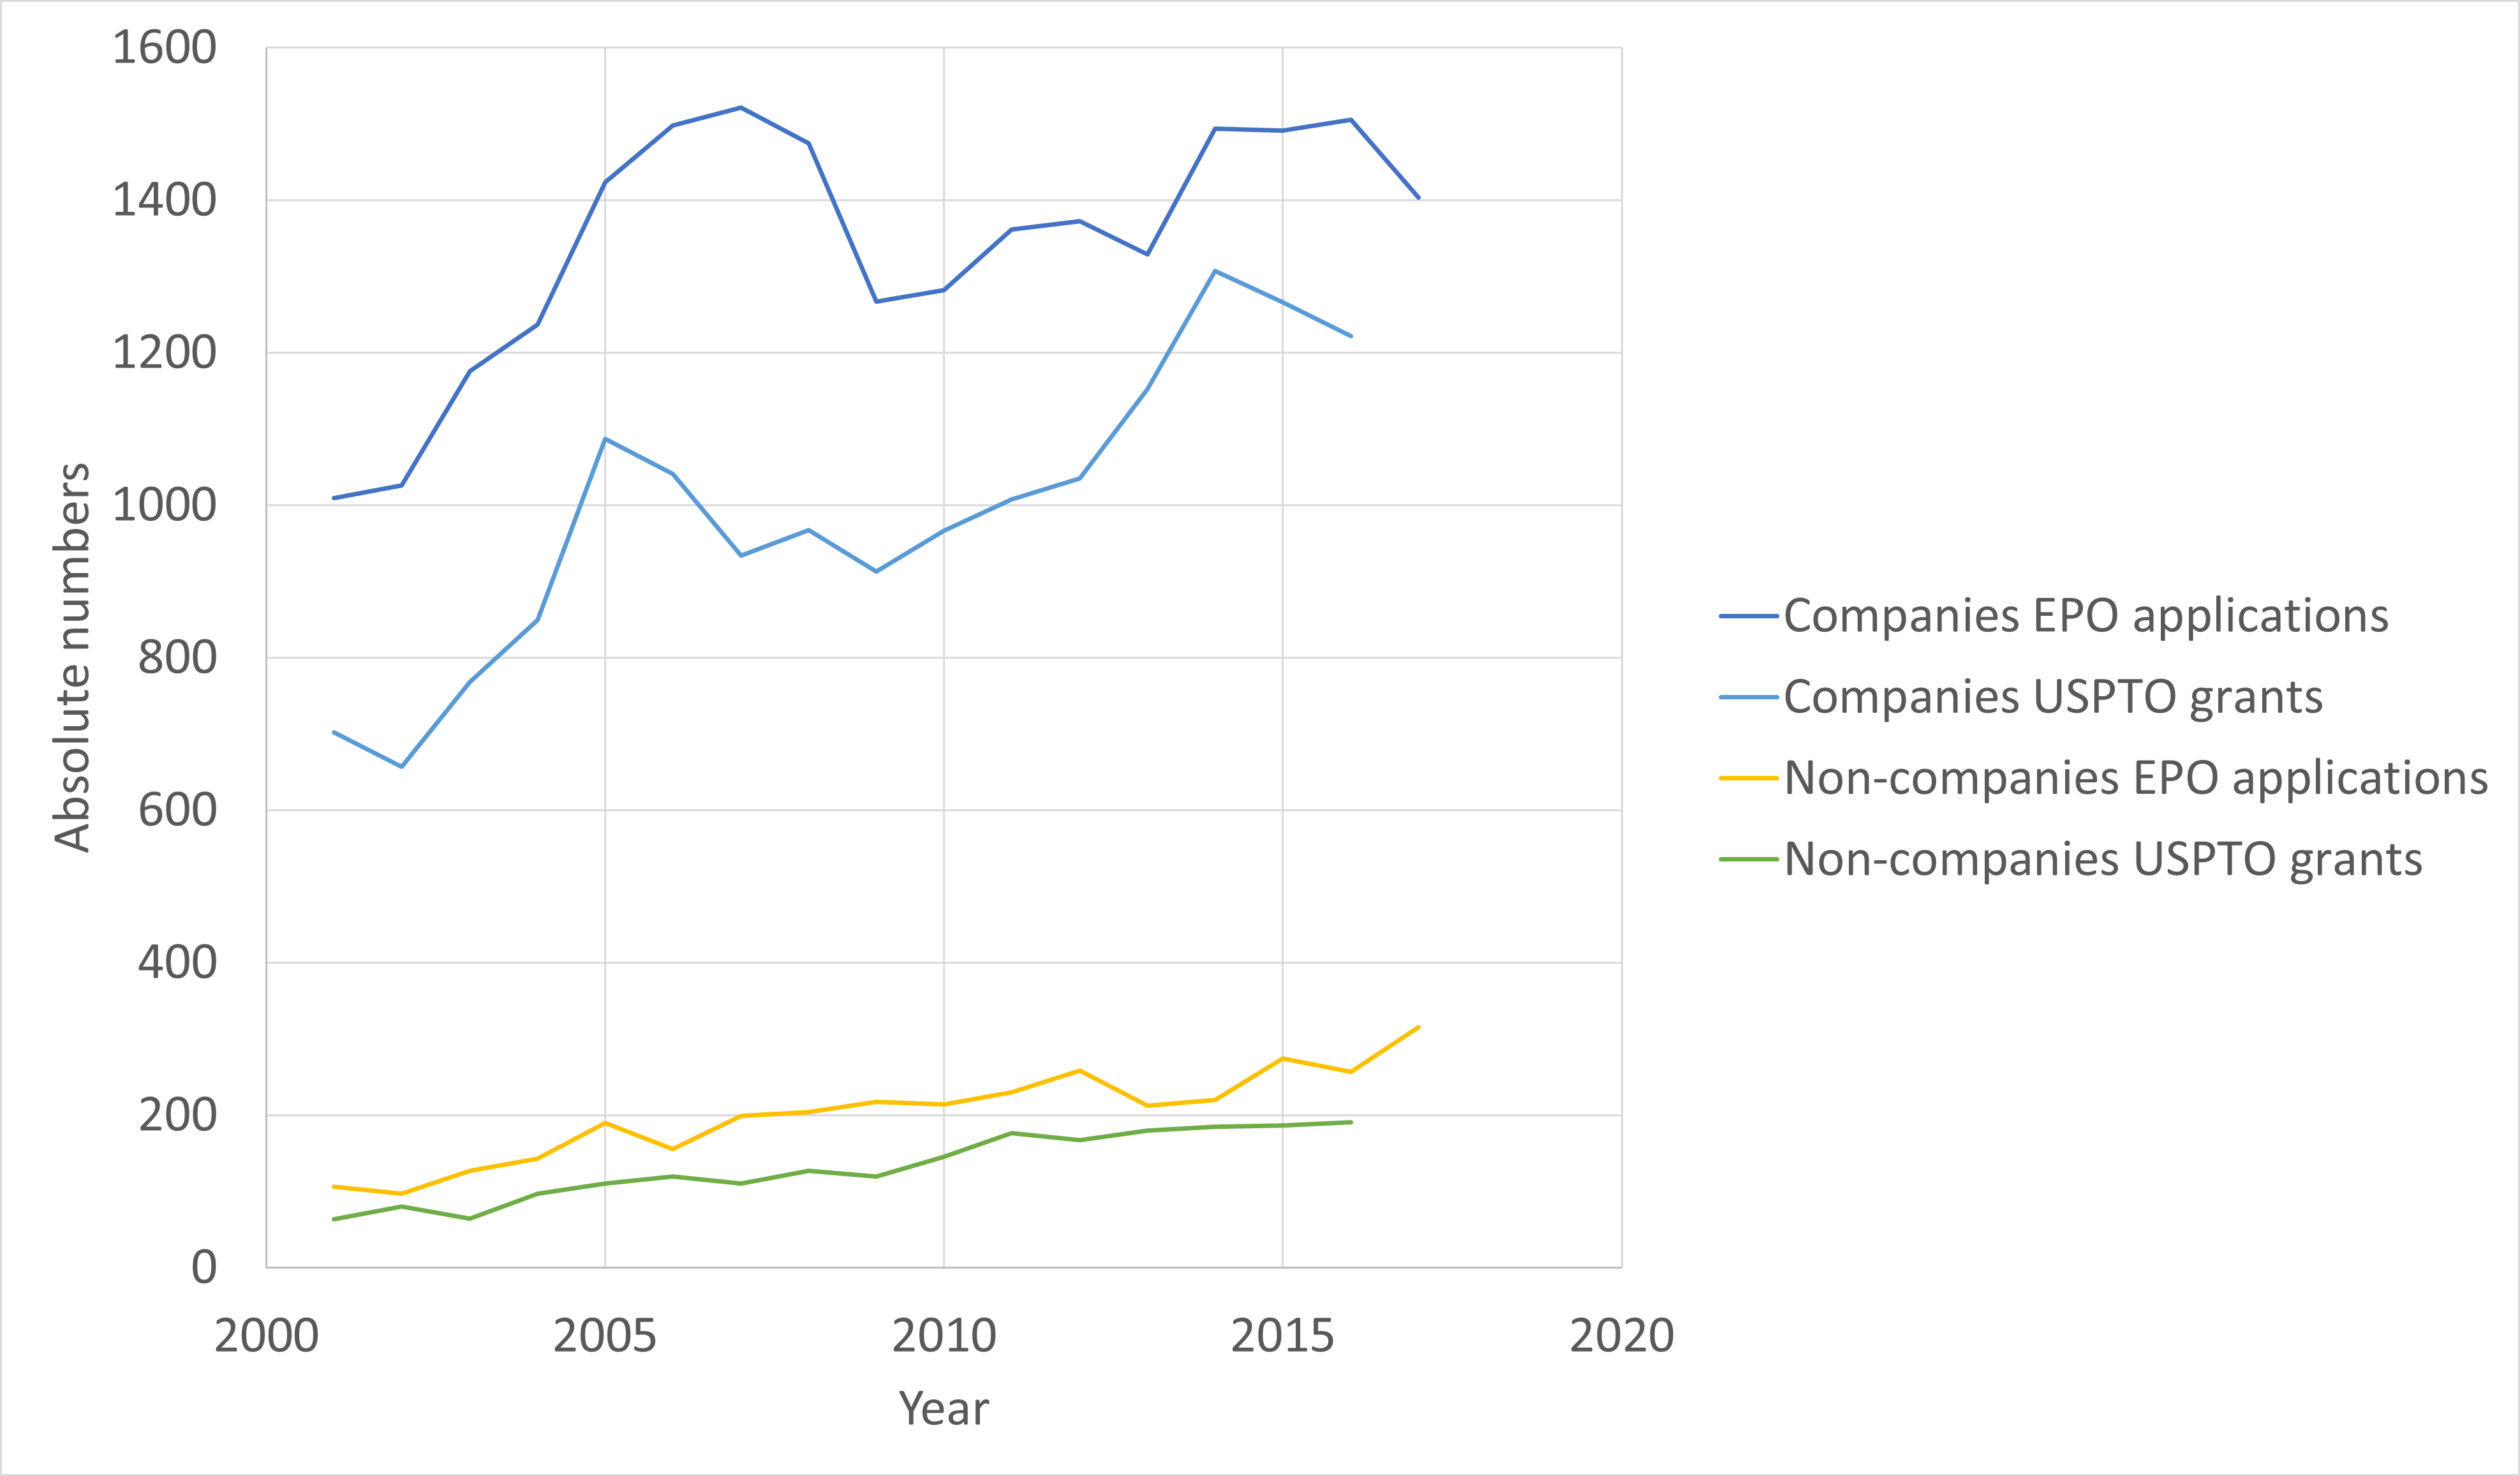
Source: ECOOM
2. Companies take a dominant role within the number of patent applications. They account for the vast majority (about 3/4) of patent applications to the EPO. Government/non-profit institutions - including the four strategic research centres IMEC, VIB, VITO and Flanders Make - account for 13%. Higher education institutions account for 10%. An international comparison (see Figure 4) shows that companies in Flanders make up a relatively small proportion (73%) of EPO patent applicants compared to the other countries. In the VARIO benchmark countries (The Netherlands, Denmark, Sweden, Finland and Switzerland) that share is >90%. At the same time, this shows that Flanders is at the top in terms of the proportion of patents associated with knowledge institutions (government/non-profit and higher education institutions), indicating their importance in Flemish technology development.
Figure 4: International comparison of EPO patent applications in 2017 breakdown by applicant organization per country
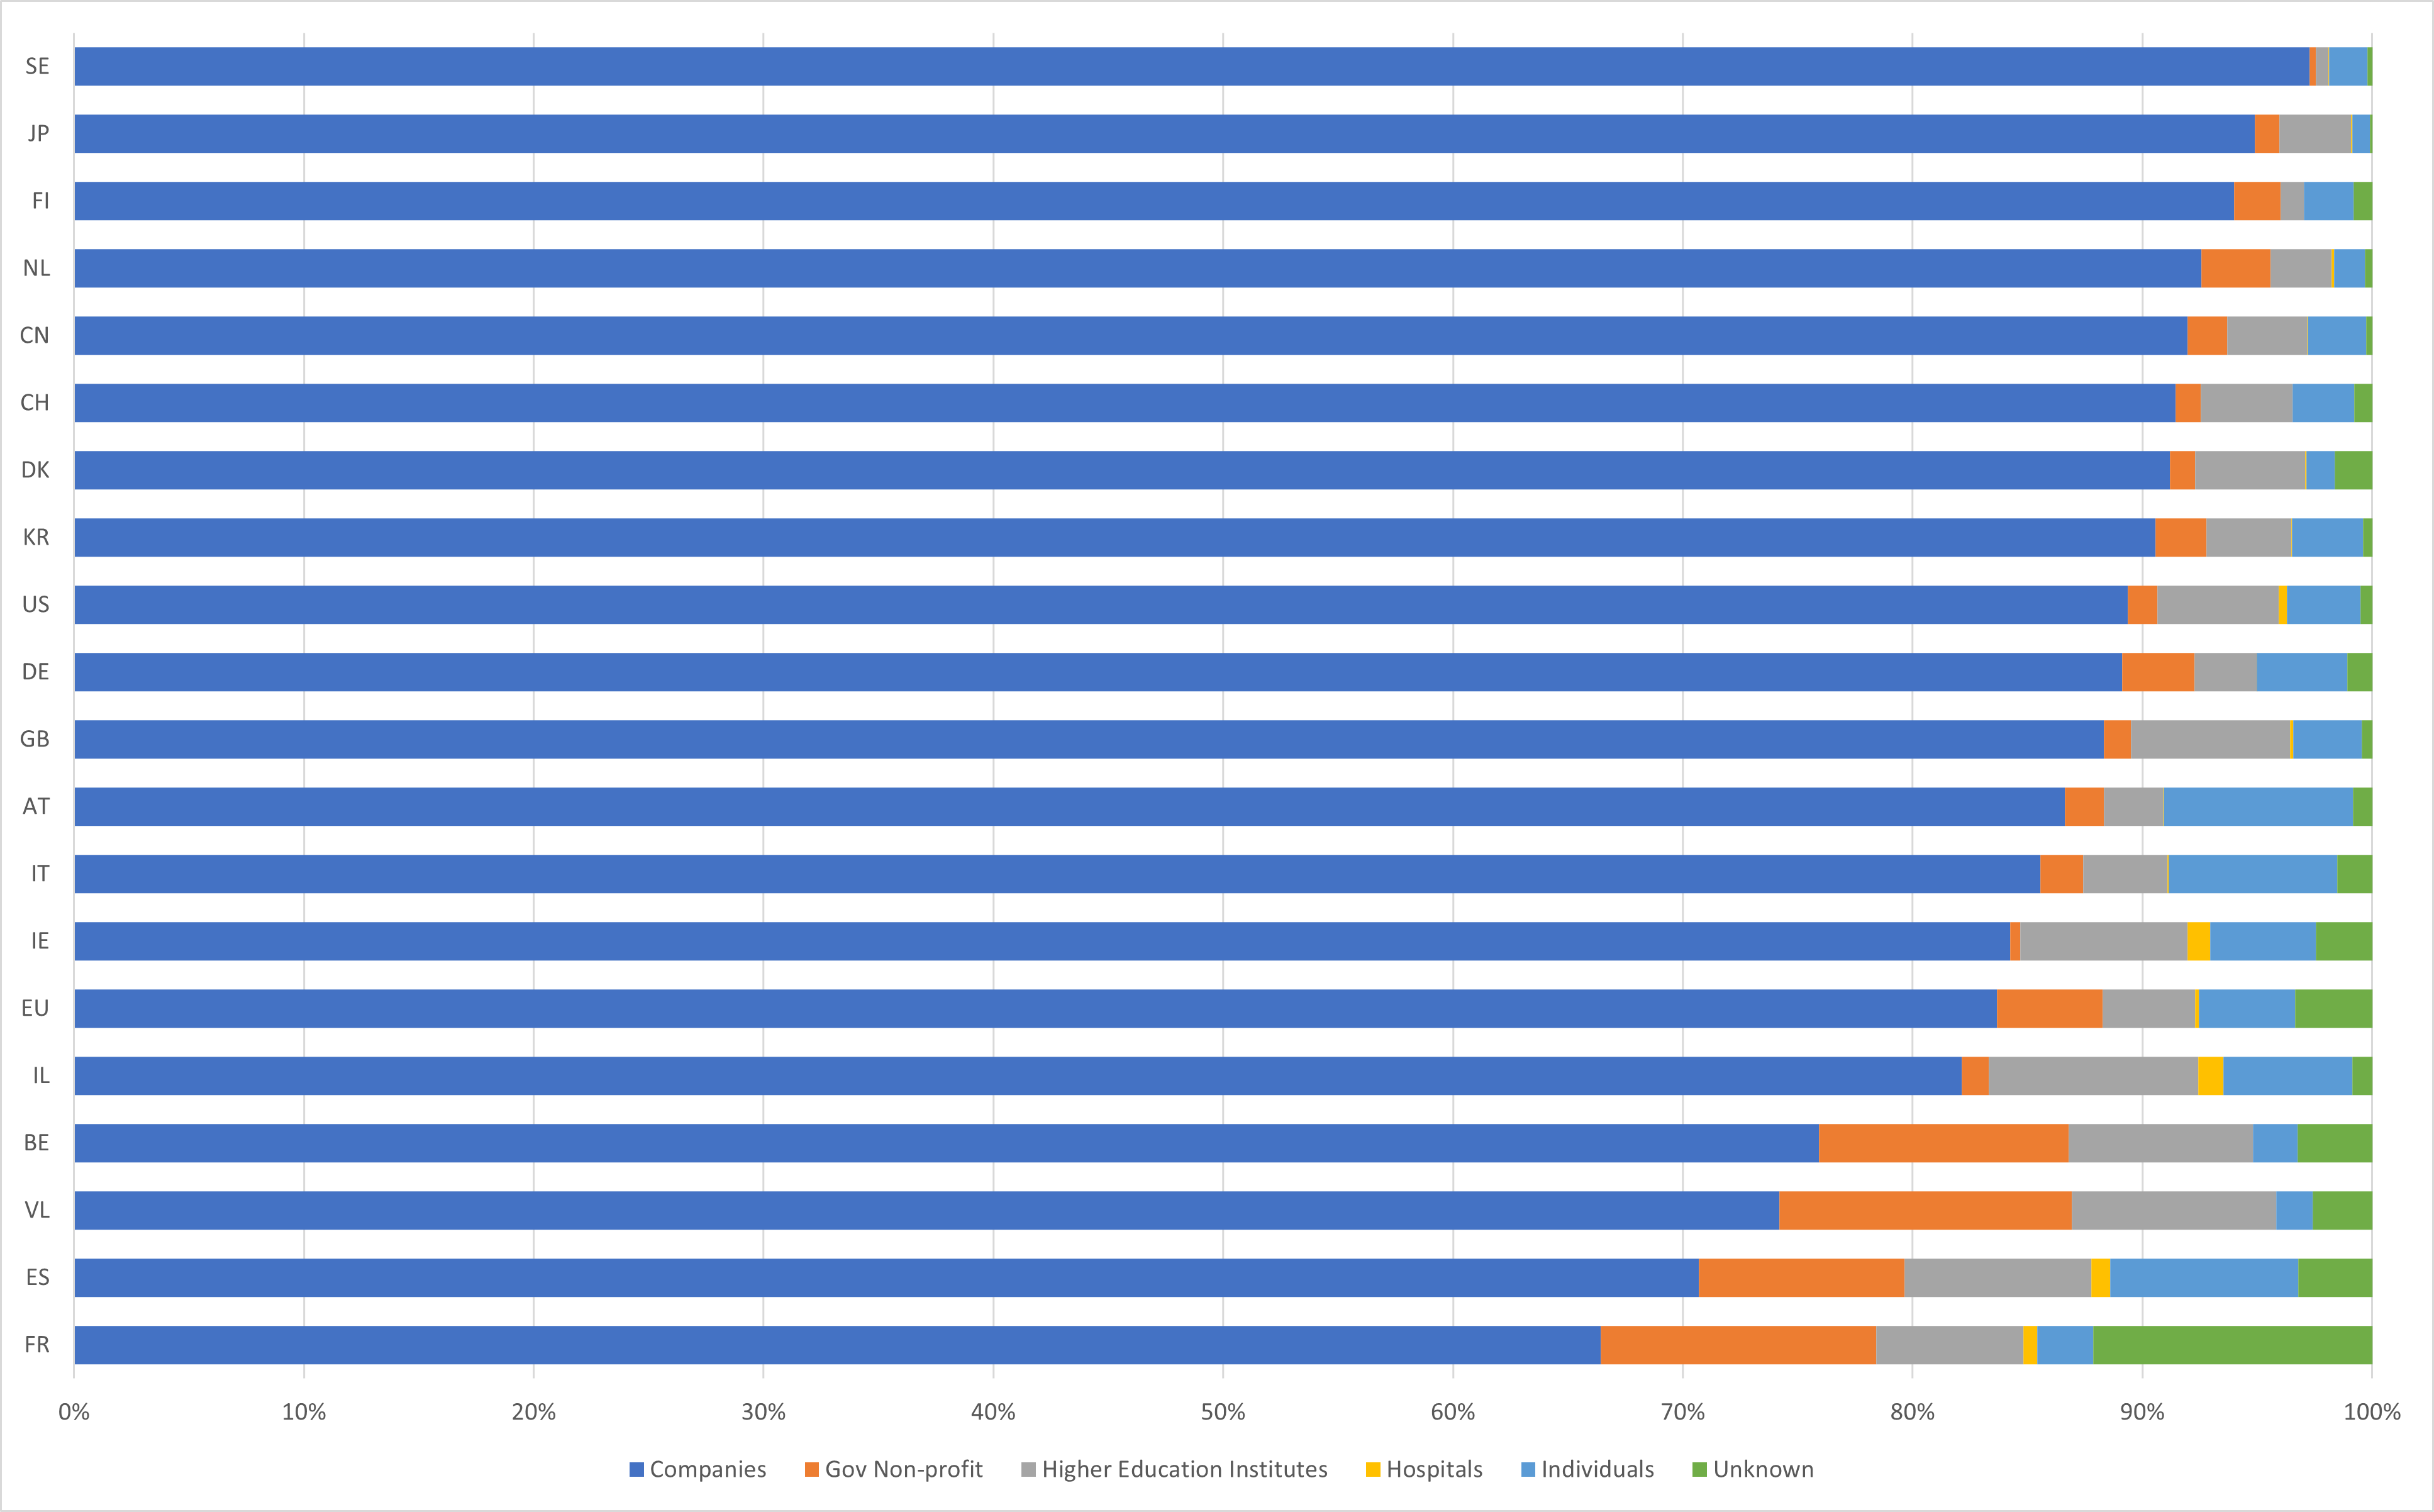
Source: ECOOM
3. Flanders ranks top in terms of patent applications by 'non-companies' (see Figure 5). Both for higher education institutions and government/public knowledge institutions (including the strategic research centres), Flanders has a top international position. With this, Flanders is clearly reaping the benefits of its vision and policy. Flanders pioneered with output-driven funding for knowledge institutions, which evolved into the current system in which KPIs and output parameters play an important role.
Figure 5: International comparison for the number of EPO-patent applications with an inventor and/or applicant in the corresponding country per million inhabitants (2017) – ‘non-companies’
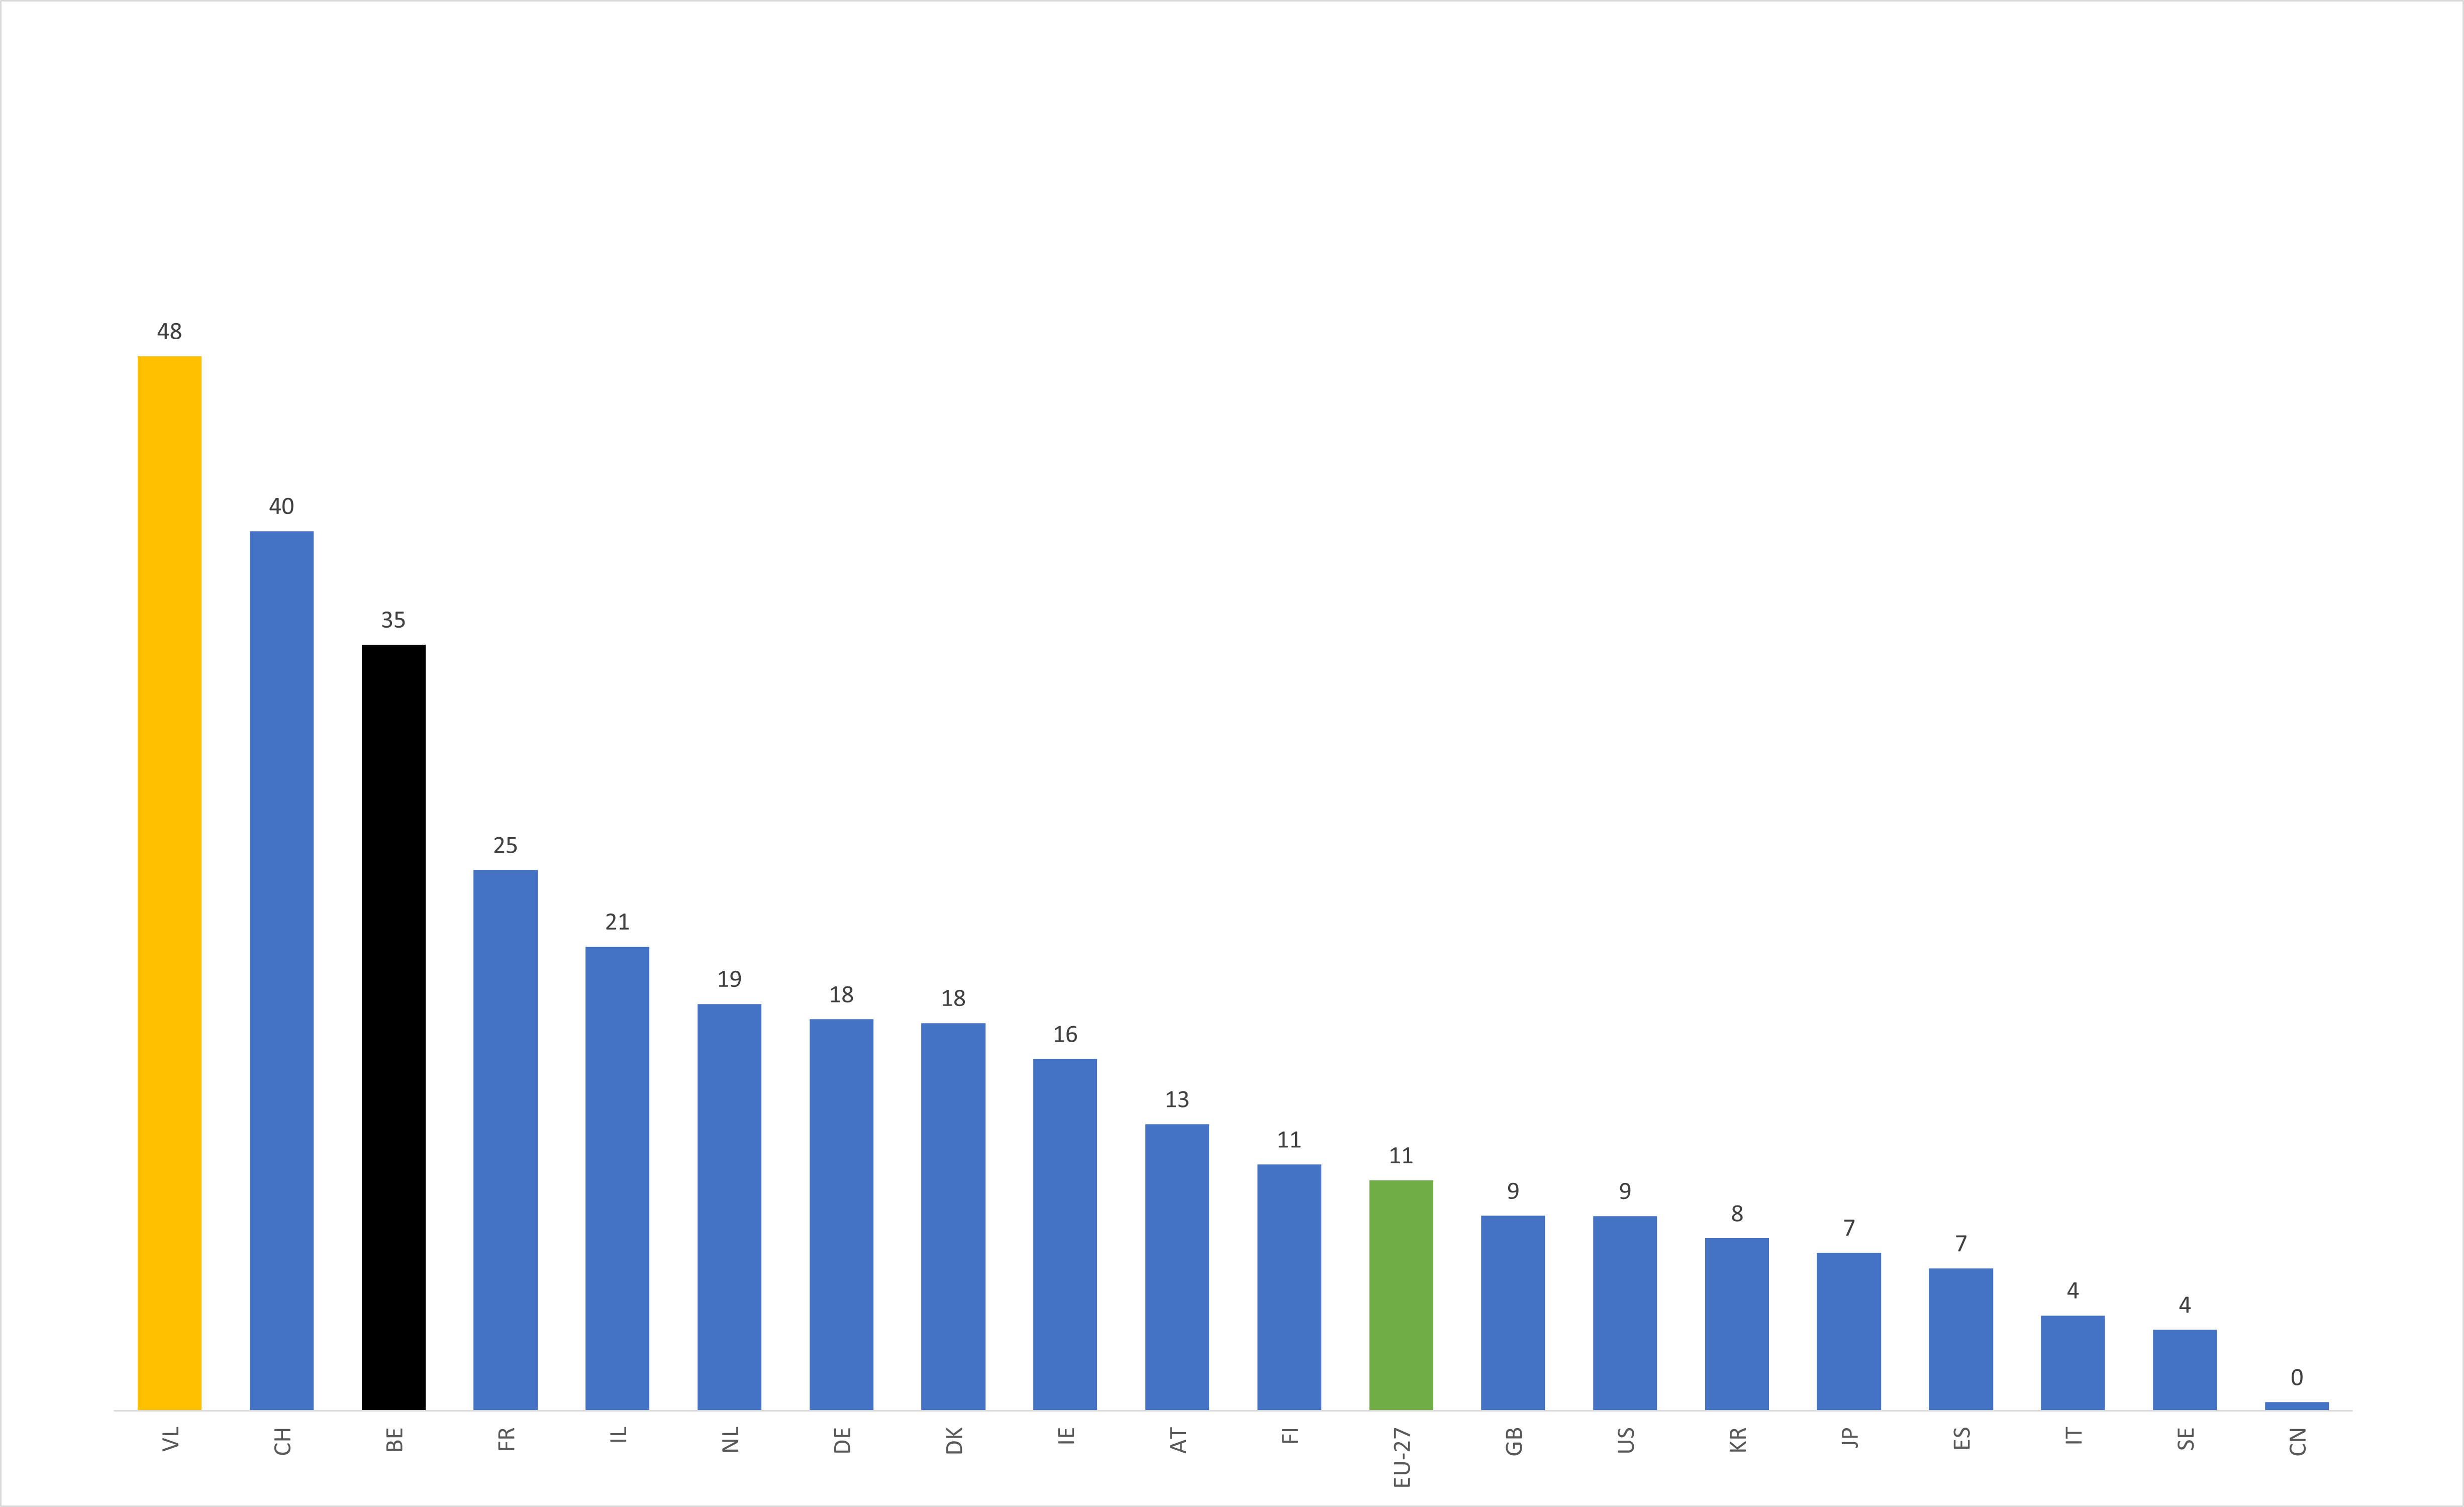
Source: ECOOM
4. The Flemish ranking with regard to patent applications by companies (see Figure 6) is ‘rather average’ and Flanders is preceded by the benchmark countries. We would like to make two remarks that may help explain Flanders' position: 1) Patenting is mainly (but not exclusively) an activity for large companies. However, Flanders has a pronounced SME landscape. 2) We also note that the (Belgian) economy has only a relatively small share of IP-intensive sectors. De top patent-intensive sectors are in manufacturing, while about 80 to 85% of the Flemish economy concerns service industries.1
1 Table 13: 2022_IPR_Intensive_Industries_FullR_en.pdf (europa.eu); https://euipo.europa.eu/tunnel-web/secure/webdav/guest/document_library/observatory/documents/reports/IPR-intensive_industries_and_economic_in_EU_2022/2022_IPR_Intensive_Industries_FullR_en.pdf
Figure 6: International comparison number of EPO patent applications with an inventor and/or applicant in the corresponding country per million inhabitants (2017) – companies

Source: ECOOM
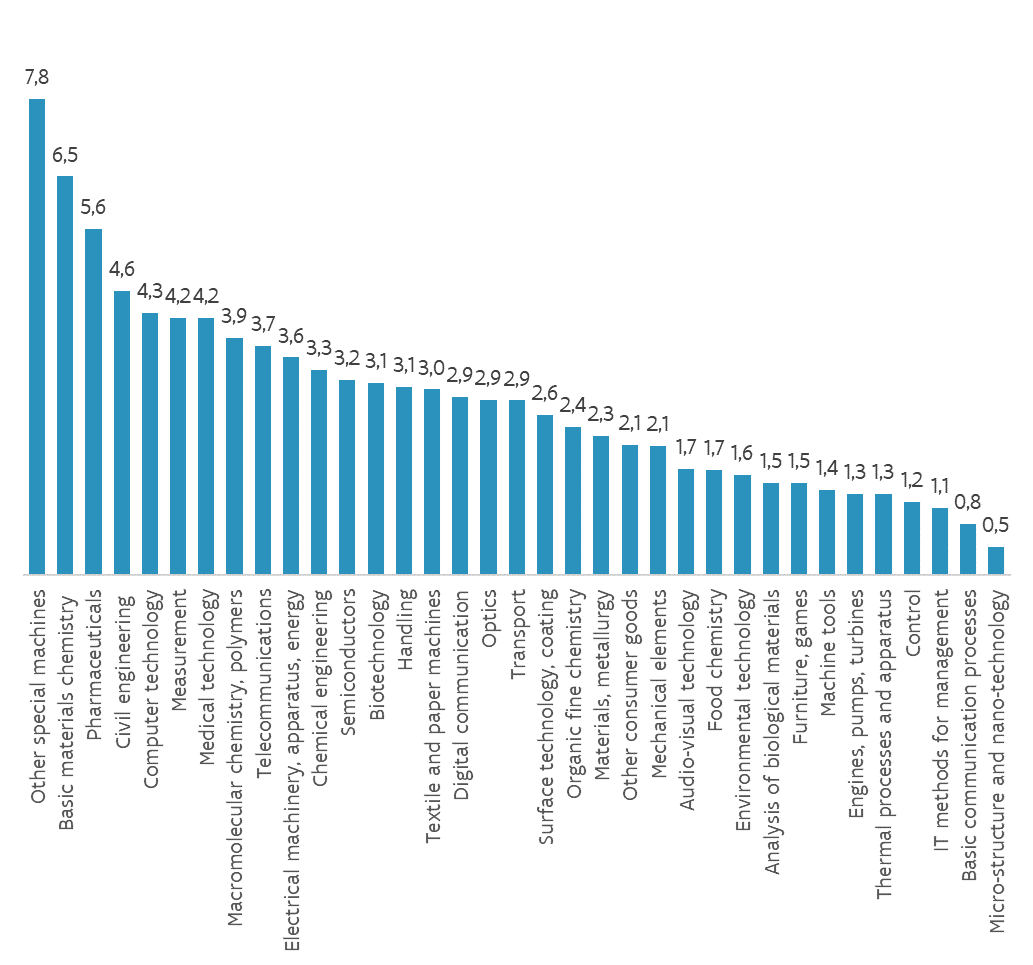
5. Within Flanders, patents in the technology domains of pharmaceuticals (top applicants are Janssen Pharmaceuticals, Ablynx, Galapagos and KU Leuven, UGent and VIB), chemistry (including basic materials chemistry Agfa-Gevaert, Allenx Belgium, Agfa Graphics, Oleon and Nitto Europe) and 'specialised machinery' (CNH Belgium, Bekaert, Bridgestone Europe and Layerwise) take the largest share (see Figure 7). The Flemish USPTO patents show an analogous trend but with 'Semiconductors and Computer Technology' (top applicants imec, KU Leuven, UGent and Melexis Technologies) also joining the top domains. Flanders has built up a relatively strong international technology position in the food sector (top applicants Bayer Cropscience, Puratos, UGent, Tereos Starch & Sweeteners Belgium, VIB), chemistry, 'specialised machinery', textiles & paper (top applicants Agfa-Gevaert, Picanol, Agfa Graphics, Van De Wiele), civil engineering (top applicants Renson Sunprotection Screens, Ideal Standard International, Unilin), micro and nanotech and semiconductors (top applicants imec, KU Leuven, Agfa-Gevaert, UGent, Melexis Technologies) and biotech (top applicants UGent, VIB, Ablynx, KU Leuven).
Figure 7: Flemish EPO patent applications between 2011-2020 per technology domain